Actions
Bug #5668
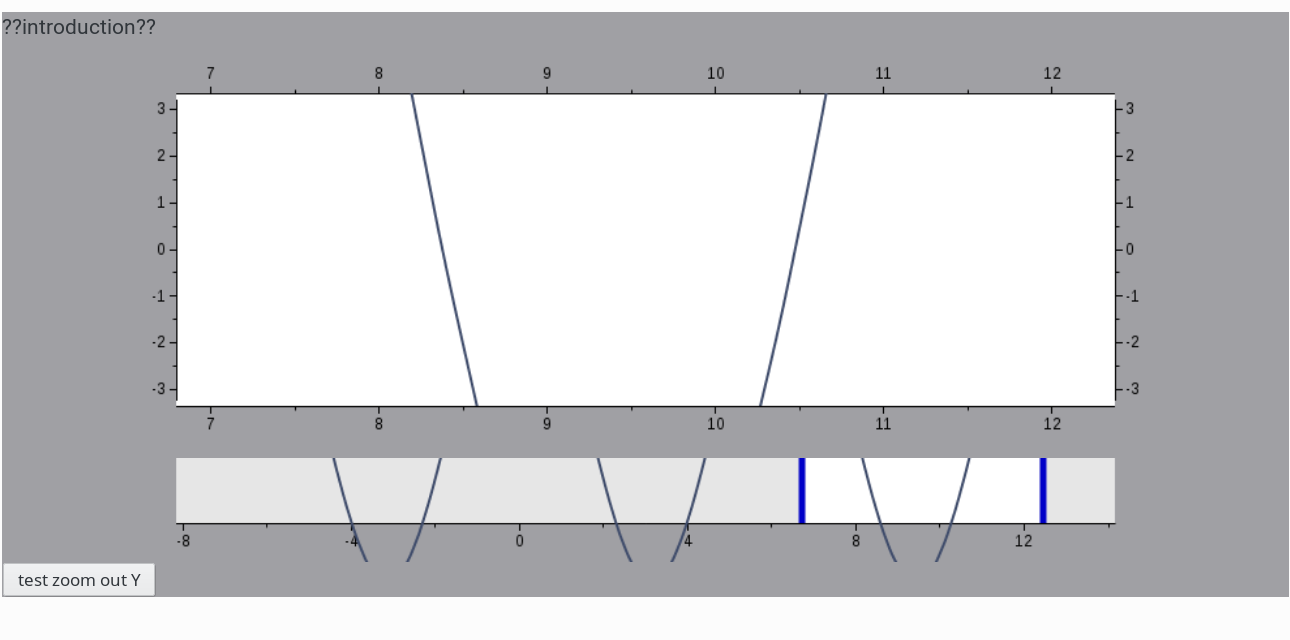
closedChanging Y WAxis::setRange can cause WAxisSliderWidget to draw a curve below the plot area.
Status:
Closed
Priority:
Normal
Assignee:
-
Target version:
-
Start date:
04/21/2017
Due date:
% Done:
0%
Estimated time:
Description
The attached project can reproduce the problem. Please click the "test zoom out Y" button.
Files
Updated by Roel Standaert about 7 years ago
- Status changed from New to Implemented @Emweb
Indeed, looks like I forgot to enable clipping there. Thanks.
Updated by Roel Standaert about 7 years ago
- Status changed from Implemented @Emweb to Resolved
Updated by Roel Standaert over 6 years ago
- Status changed from Resolved to Closed
Actions