Actions
Feature #5674
openMultiple series for WAxisSliderWidget.
Status:
New
Priority:
Normal
Assignee:
-
Target version:
-
Start date:
04/24/2017
Due date:
% Done:
0%
Estimated time:
Description
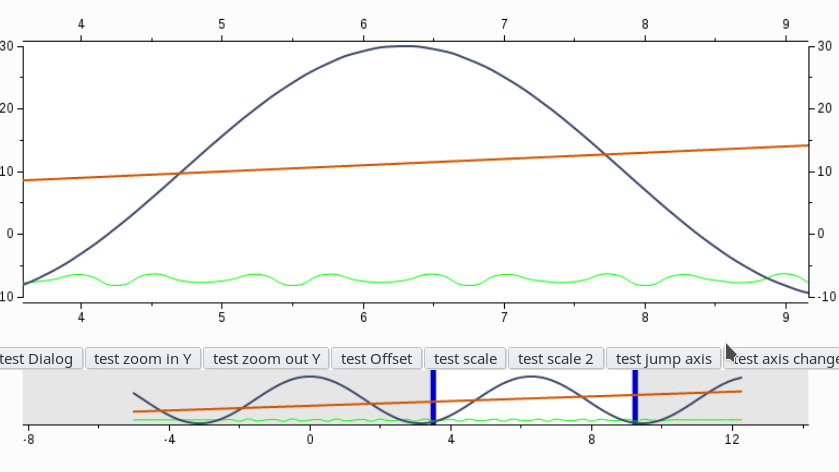
Apparently, WAxisSliderWidget cannot show more than one series at a time.
And, It would be nice if there is a method to automatically use the same series color that are shown in the main chart.
The code below is a temporary add-only patch that allowed WAxisSliderWidget to add and show multiple series at time.
diff --git a/src/Wt/Chart/WAxisSliderWidget b/src/Wt/Chart/WAxisSliderWidget
index 717dc33..58d42fc 100644
--- a/src/Wt/Chart/WAxisSliderWidget
+++ b/src/Wt/Chart/WAxisSliderWidget
@@ -50,6 +50,7 @@ public:
   virtual ~WAxisSliderWidget();

   void setSeries(WDataSeries *series);
+  void setSeries(const std::vector<WDataSeries*>& series);

   /*! \brief Set the pen to draw the data series with.
    */
@@ -165,6 +166,7 @@ private:
   const WCartesianChart *chart() const;

   WDataSeries *series_;
+  std::vector<WDataSeries* > seriesVector_;
   WPen seriesPen_;
   WPen *selectedSeriesPen_;
   WBrush handleBrush_;

diff --git a/src/Wt/Chart/WAxisSliderWidget.C b/src/Wt/Chart/WAxisSliderWidget.C
index 29f05f0..c69be29 100644
--- a/src/Wt/Chart/WAxisSliderWidget.C
+++ b/src/Wt/Chart/WAxisSliderWidget.C
@@ -98,6 +98,14 @@ void WAxisSliderWidget::setSeries(WDataSeries *series)
   }
 }

+void WAxisSliderWidget::setSeries(const std::vector<WDataSeries*>& series)
+{
+  seriesVector_ = series;
+  WDataSeries* firstSeries = seriesVector_[0];
+  seriesVector_.erase(seriesVector_.begin());
+  this->setSeries(firstSeries);
+}
+
 void WAxisSliderWidget::setSeriesPen(const WPen& pen)
 {
   if (pen != seriesPen_) {
@@ -410,6 +418,7 @@ void WAxisSliderWidget::paintEvent(WPaintDevice *paintDevice)
   }

   WPainterPath curve;
+  WTransform SeriesTransform;
   {
     WTransform t = WTransform(1,0,0,1,seriesArea.left(),seriesArea.top()) *
       WTransform(seriesArea.width() / chartArea.width(), 0, 0, seriesArea.height() / chartArea.height(), 0, 0) *
@@ -418,8 +427,11 @@ void WAxisSliderWidget::paintEvent(WPaintDevice *paintDevice)
       t = WTransform(0,1,1,0,selectionAreaPadding(Left) - selectionAreaPadding(Right) - 5,0) * t * WTransform(0,1,1,0,0,0);
     }
     curve = t.map(chart()->pathForSeries(*series_));
+
+    SeriesTransform = t;
   }

+
   {
     WRectF leftHandle = hv(WRectF(-5, top, 5, h - top - bottom));
     WTransform t = (WTransform(1,0,0,1,left,-top) *
@@ -467,6 +479,12 @@ void WAxisSliderWidget::paintEvent(WPaintDevice *paintDevice)
     painter.setPen(seriesPen());
     painter.drawPath(curve);
   }
+
+  for(std::vector<WDataSeries* >::const_iterator it = seriesVector_.begin(); it != seriesVector_.end(); ++it){
+    painter.setPen((*it)->pen()); //< use pen from series.
+    const WPainterPath& curvex = SeriesTransform.map(chart()->pathForSeries(*(*it)));
+    painter.drawPath(curvex);
+  }

   if (getMethod() == HtmlCanvas) {
     WApplication *app = WApplication::instance();
Files
Actions